What do you do when your MPS language compiles and builds with no errors but behaves unexpectedly? Menu items you want to see don’t show up, the type system shows a strange error that comes from nowhere, or the generator produces unexpected output.
In a “classic” development situation, this would be the point where you would start your program under a debugger or add some print or log statements. But how do you debug your MPS language? How do you even see what you print?
While there is no simple and universal method, we collected various tools and techniques that you can use to gain insight into various subsystems of MPS, determine how and why the reality deviates from your expectations, and hopefully get yourself unstuck.
The MPS built-in debugger
You may have seen that MPS has a built-in debugger, and your first inclination could have been to reach for that. Our experience with it is mixed. While being fairly easy to set up and use compared to full-blown remote debugging (which we also cover below), it has not kept its pace with the general Java debugger in, say, IntelliJ IDEA. In particular, while you will be able to step through MPS-generated code, MPS internal Java sources remain inaccessible to this debugger.
Tracing and analysis tools
A better option is to use the analysis tools built specifically for the language aspect you are having trouble with. For aspects that have non-trivial internal logic, such as editor, typesystem, or generator, MPS provides tracing and analysis tools to help visualize the logic.
Editor
- Menu Trace can be used to learn which transformation or substitute menu contributed a particular action to the completion menu or to the context assistant.
- Reflective Editor and Node Explorer show the true underlying structure of the model, as opposed to what the projectional editor is showing.
Other tools that are not as frequently useful:
- Cell Explorer (right click on a node in the editor → Language Debug → Show Cell in Explorer) shows the tree of editor cells for a particular node. Useful mostly only when you develop custom editor cells, which is quite rare.
Typesystem
- Go to Rule Which Caused Error, invoked via the context menu (under Language Debug) or by pressing
Ctrl/Cmd+Alt+R, will quickly navigate to the rule that produced an error message on the current node. - Show Node Type action shows the computed type of a node, if any.
- Typesystem Trace provides insight into the execution of the typesystem engine. It is quite complicated to understand so not often useful but better than nothing.
The image below shows typesystem tools in action:
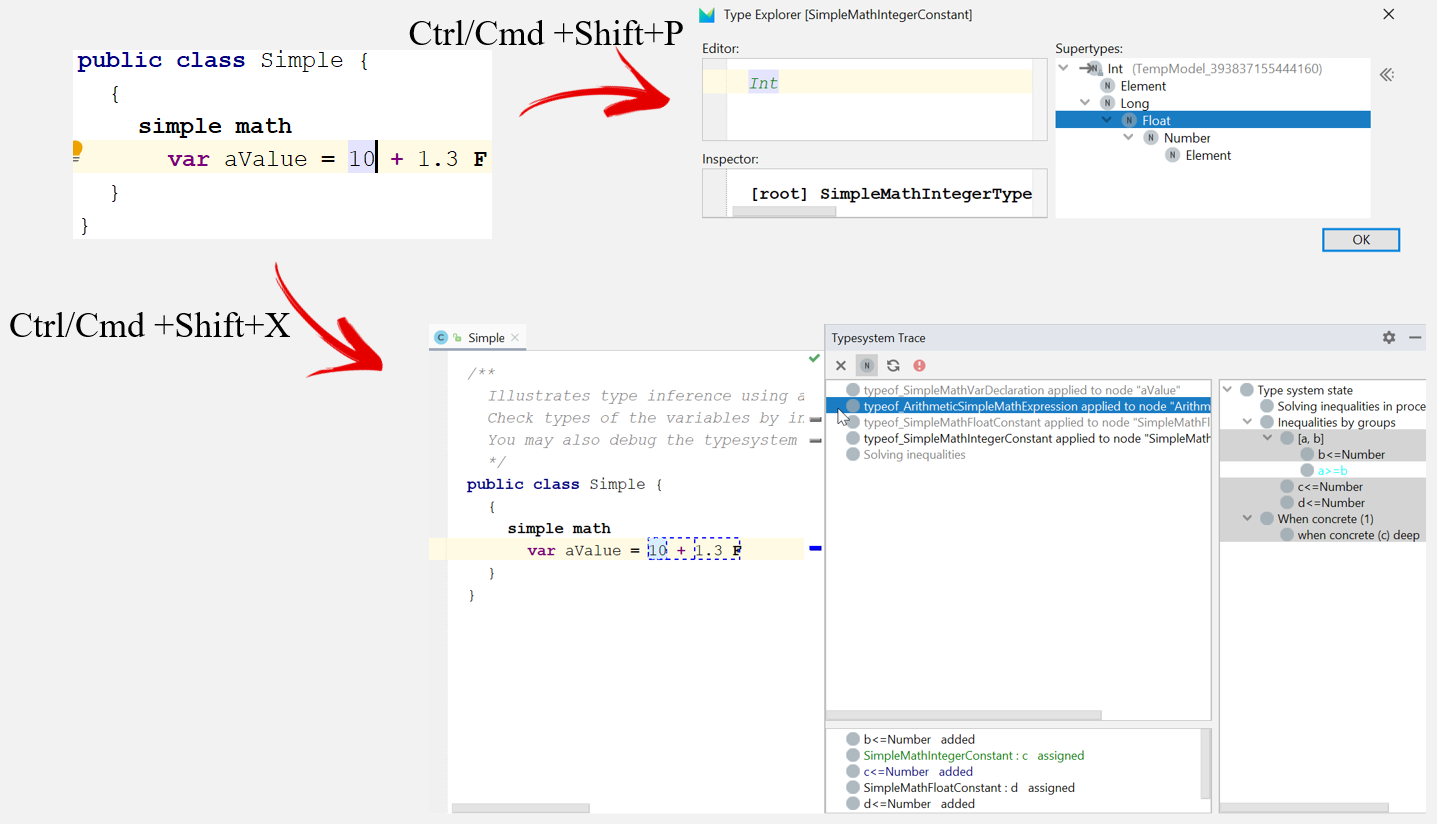
Typesystem tools
Generator
Transient Models and Generation Trace/Traceback are the tools to analyze what is happening inside a generator. For an example of how they were used to find an error in the generator, read this blog post
You can also use logging while in the generator.
Other aspects
There are no tools for debugging other aspects such as behavior, constraints, intentions or plugin actions specifically. We found the MPS Console and logging to be helpful on a few occasions when debugging them.
Experimenting in the MPS Console
The MPS Console provides an interactive prompt (REPL) where you can write and execute code that works on the models in the current project. This comes in handy when debugging code-intensive aspects such as behavior or constraints: you can, for example, copy and paste bits of code from the query functions, execute them and inspect the results.
Logging
When the tools don’t help directly, building logging and tracing into your code can still help you understand what is going on, whether a given piece of code is invoked at all, and with which parameter values. Logging is a large enough topic to deserve a separate article.
The nuclear option: remote debugging
When all else fails you can also debug MPS remotely, just like any other Java application. In this case, “remotely” doesn’t necessarily mean “from another computer”. After some configuration you can attach to the running MPS instance a debugger running on the same computer.
Setting up remote debugging is more involved than the previous approaches but it can be much more powerful because you are able to debug MPS internals, add watch points, interactively inspect data structures, or evaluate code, and so on. In short, you can use all the debugging tools that a modern IDE such as IntelliJ IDEA provides.
Acknowledgments
Thanks to Eugen Schindler from DSLFoundry for contributing to this article.