When MPS behaves unexpectedly and simple attempts to pinpoint the cause fail, it may become necessary to go deep and unleash the power of a full-blown debugger on the generated code. MPS being a Java application, it is possible to debug it remotely. The configuration involved is non-trivial, however, and this article will show you how to set up remote debugging step-by-step using IntelliJ IDEA Community Edition.
Note that the term remote debugging doesn’t necessarily mean debugging from another computer. You can just as well attach to the running MPS process a debugger running on the same computer, just in a separate process.
To set up remote debugging with IDEA we will need to create a project with our sources and a Remote JVM Debug run configuration. Then we need to configure MPS so that it will listen for the debugger.
Setting up IDEA for remote debugging
Here is how to set up remote debugging with MPS and IntelliJ IDEA:
-
Download and install IntelliJ IDEA, the Community edition is enough.
-
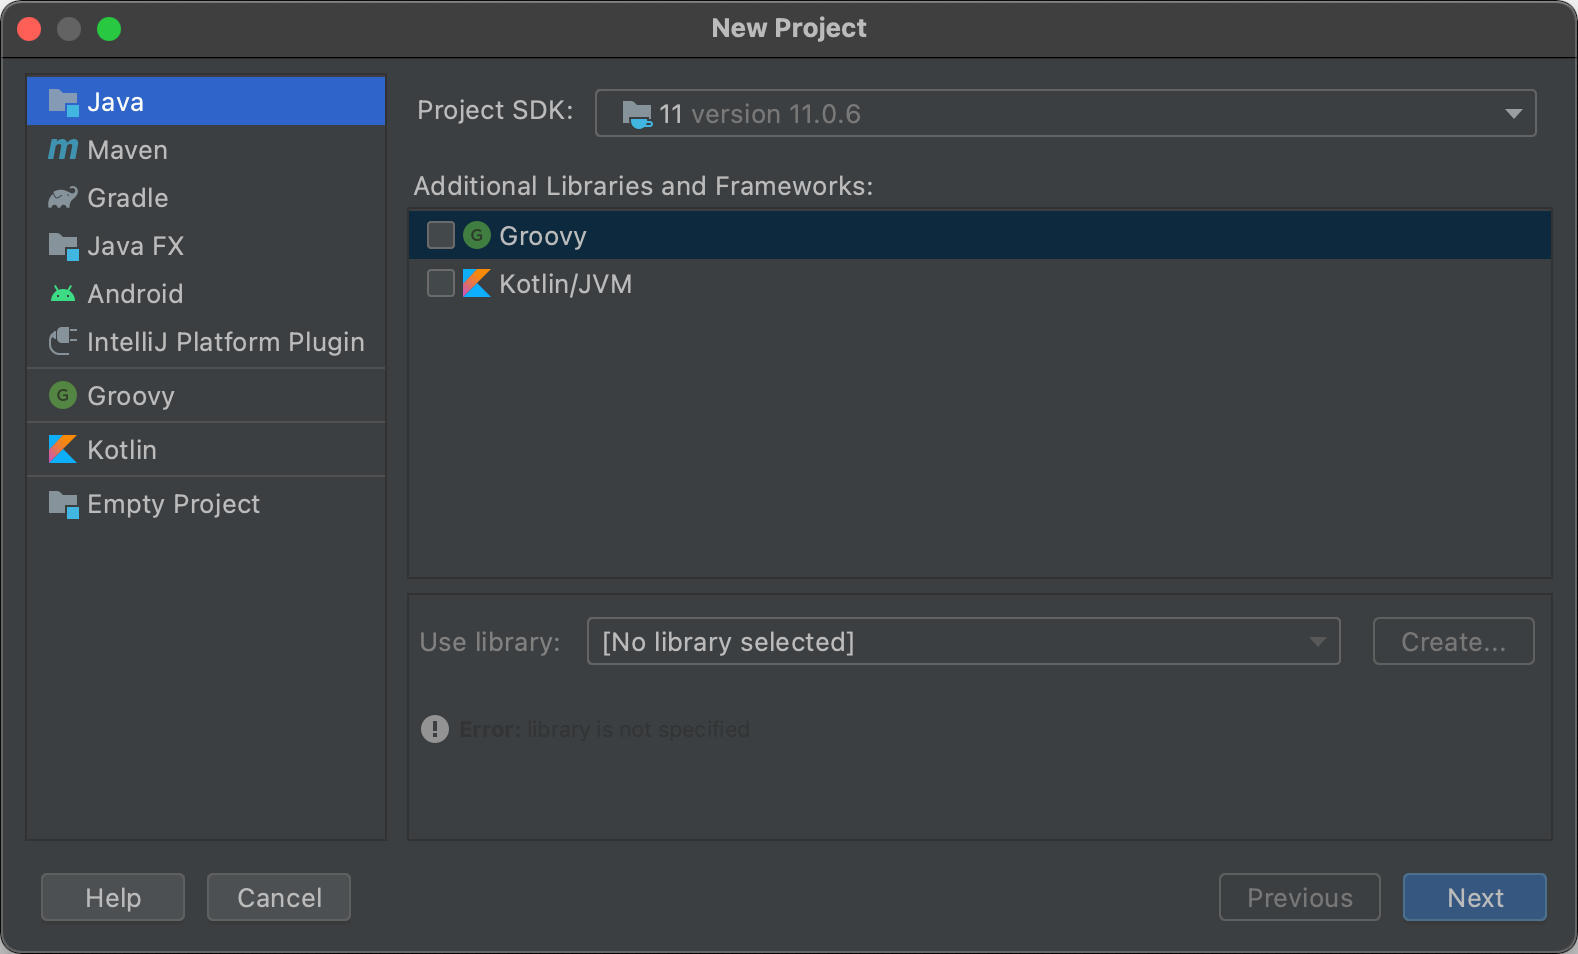
Create an empty project in IDEA:
-
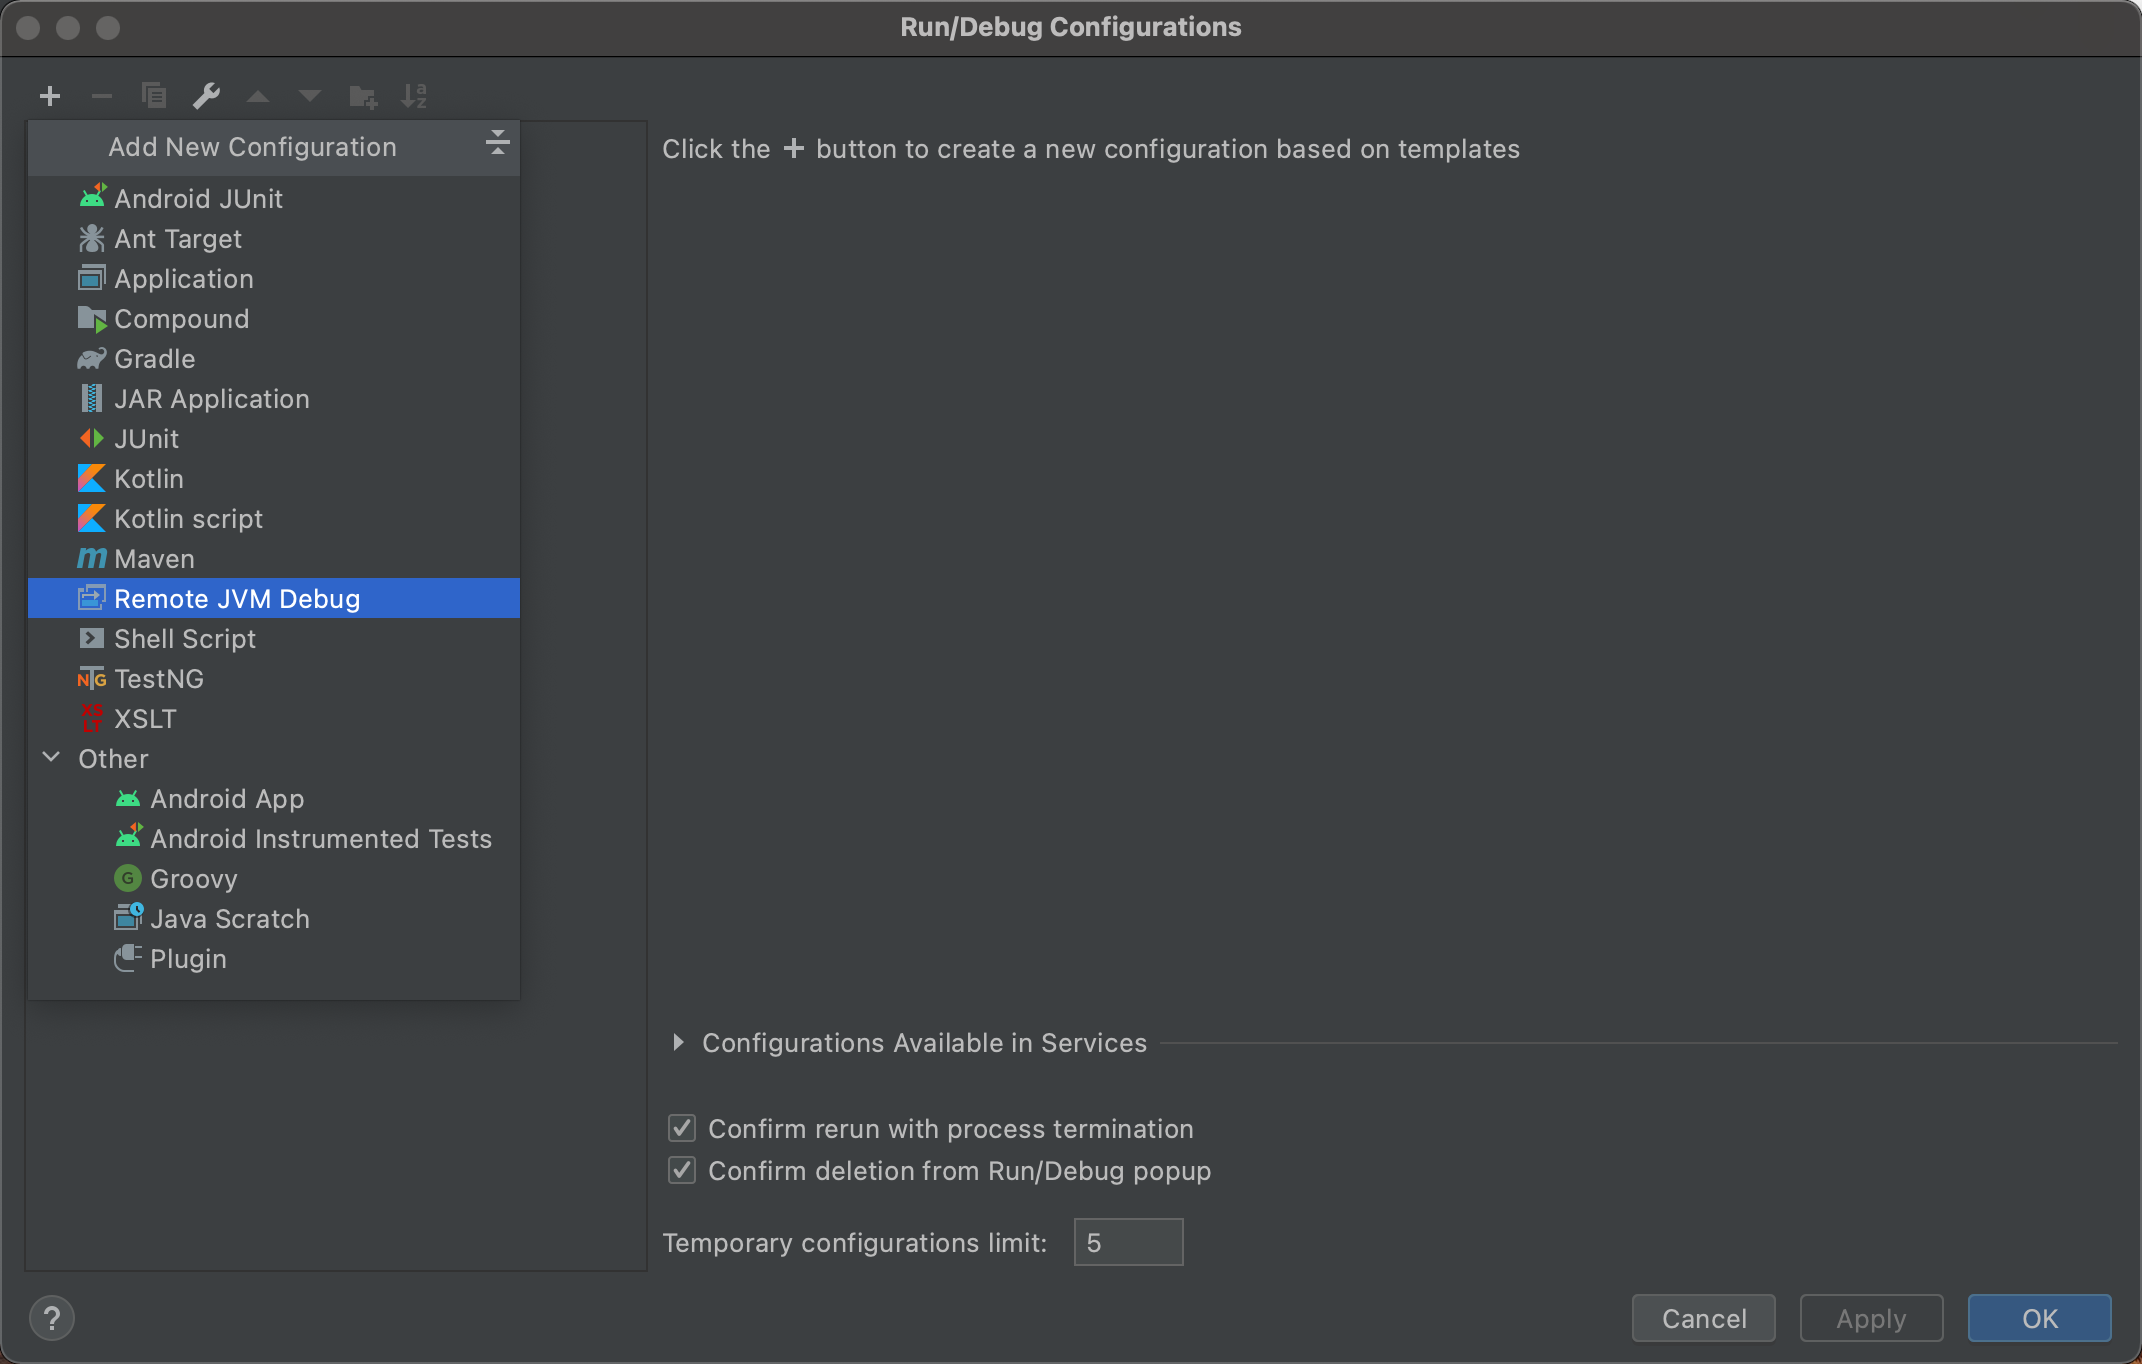
Create a Remote JVM Debug run configuration in IDEA:
-
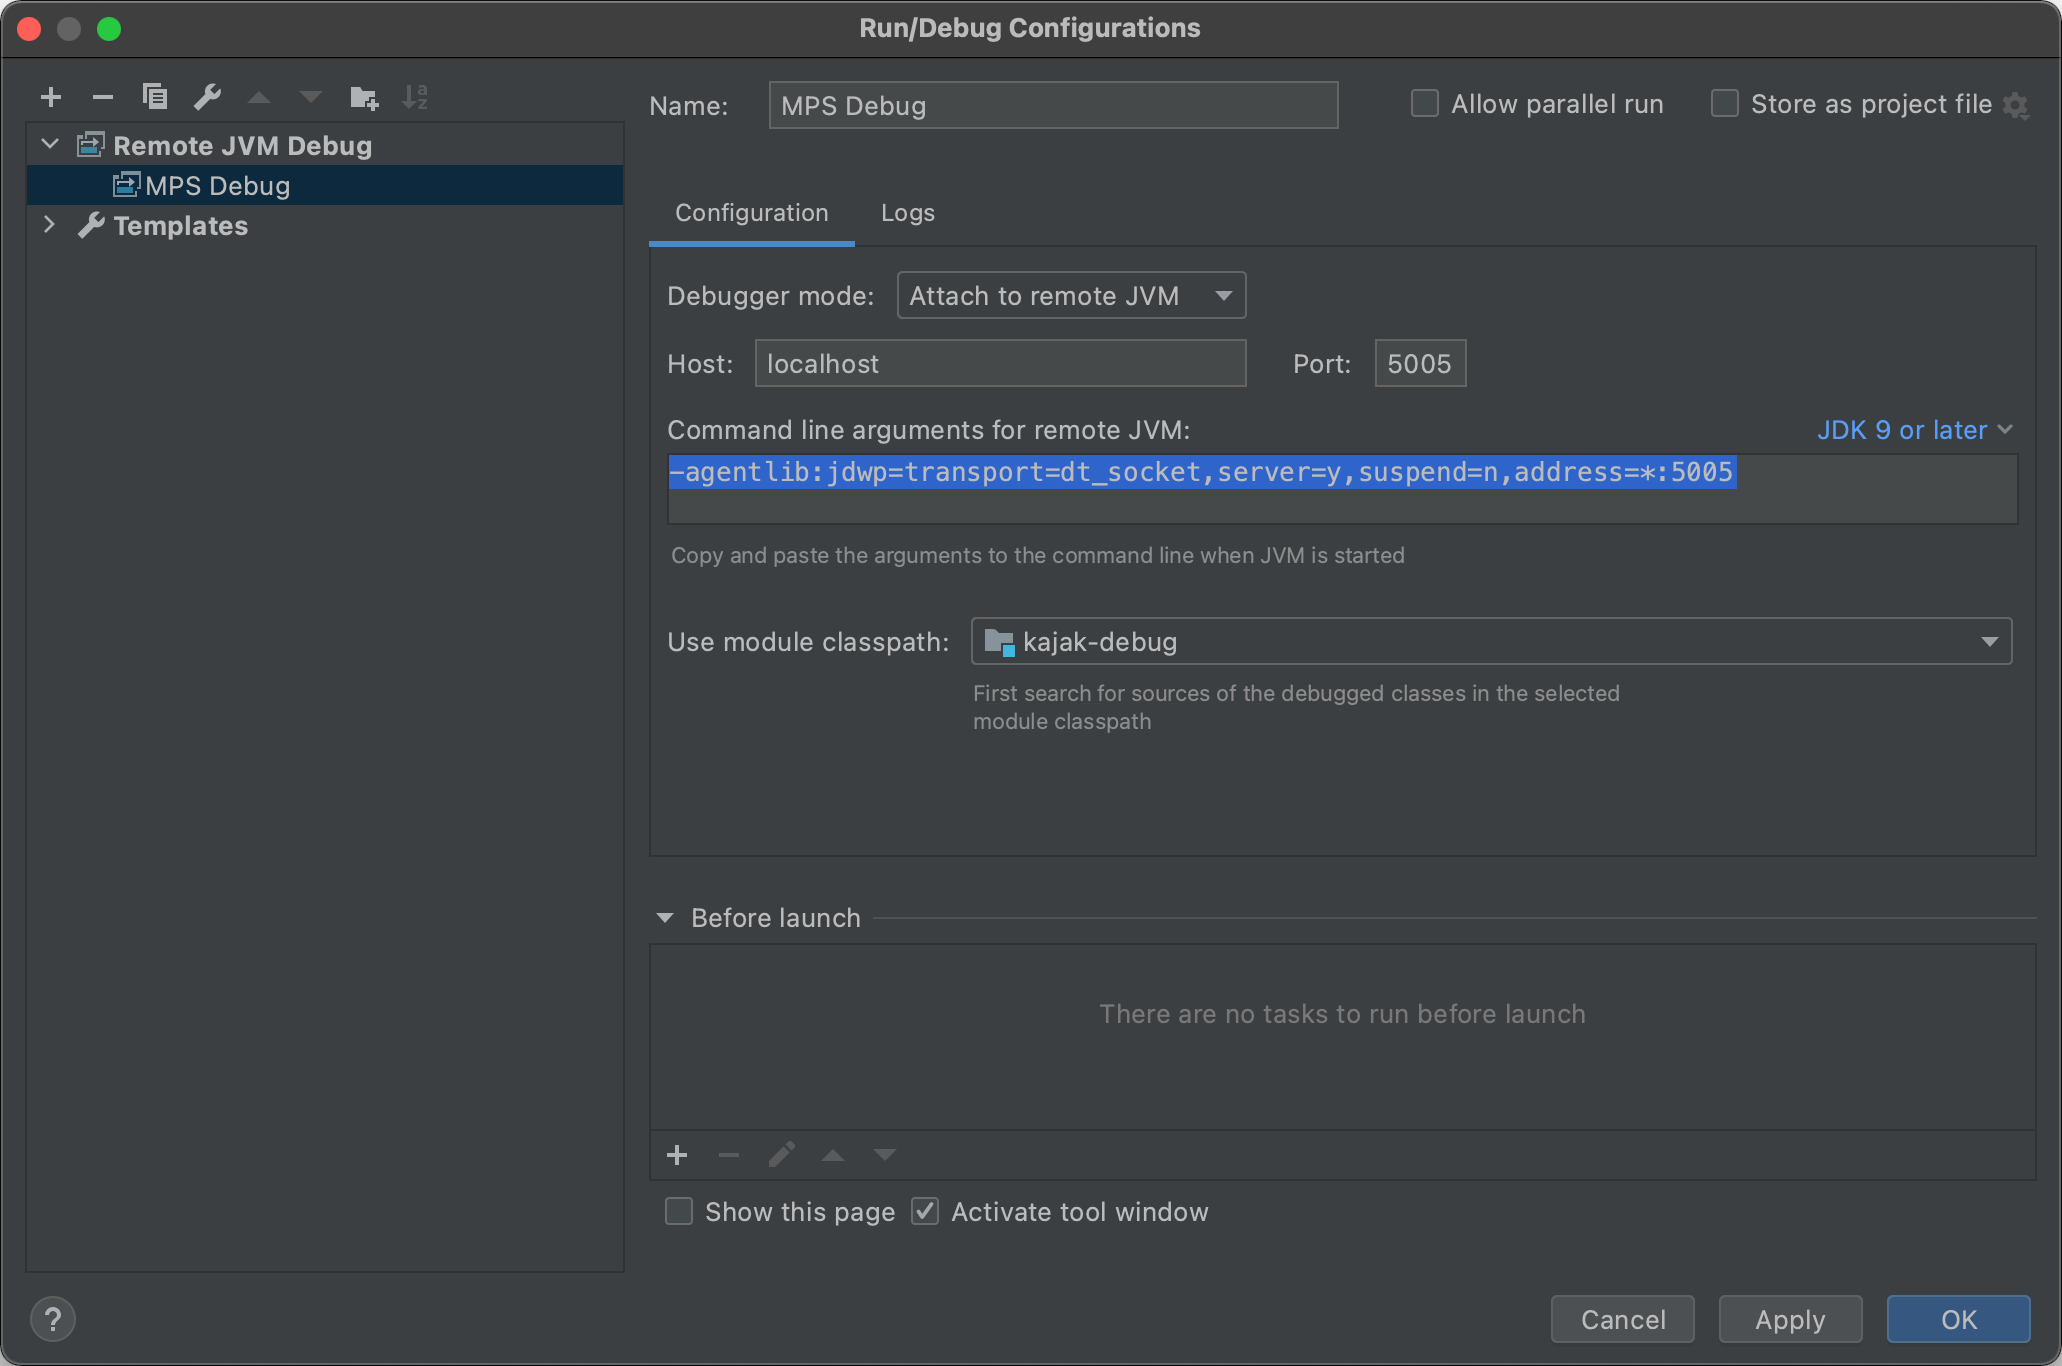
Copy the command line arguments for the remote JVM:
Setting up MPS for remote debugging
-
Edit the MPS custom VM options (Help -> Edit Custom VM Options…):
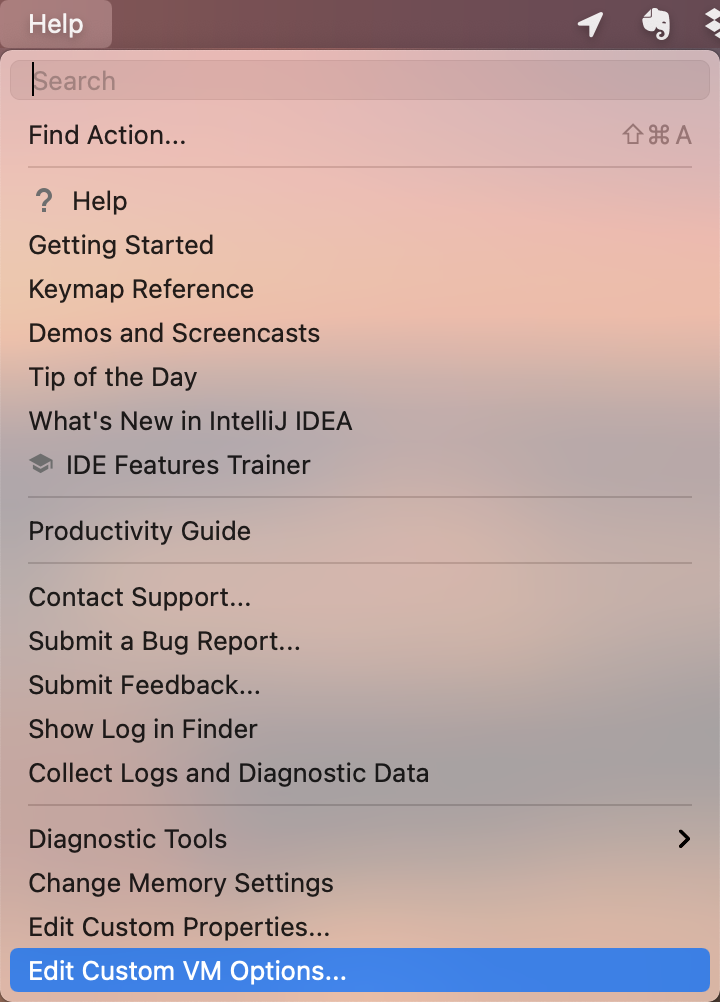
to include the command line arguments copied from IDEA:
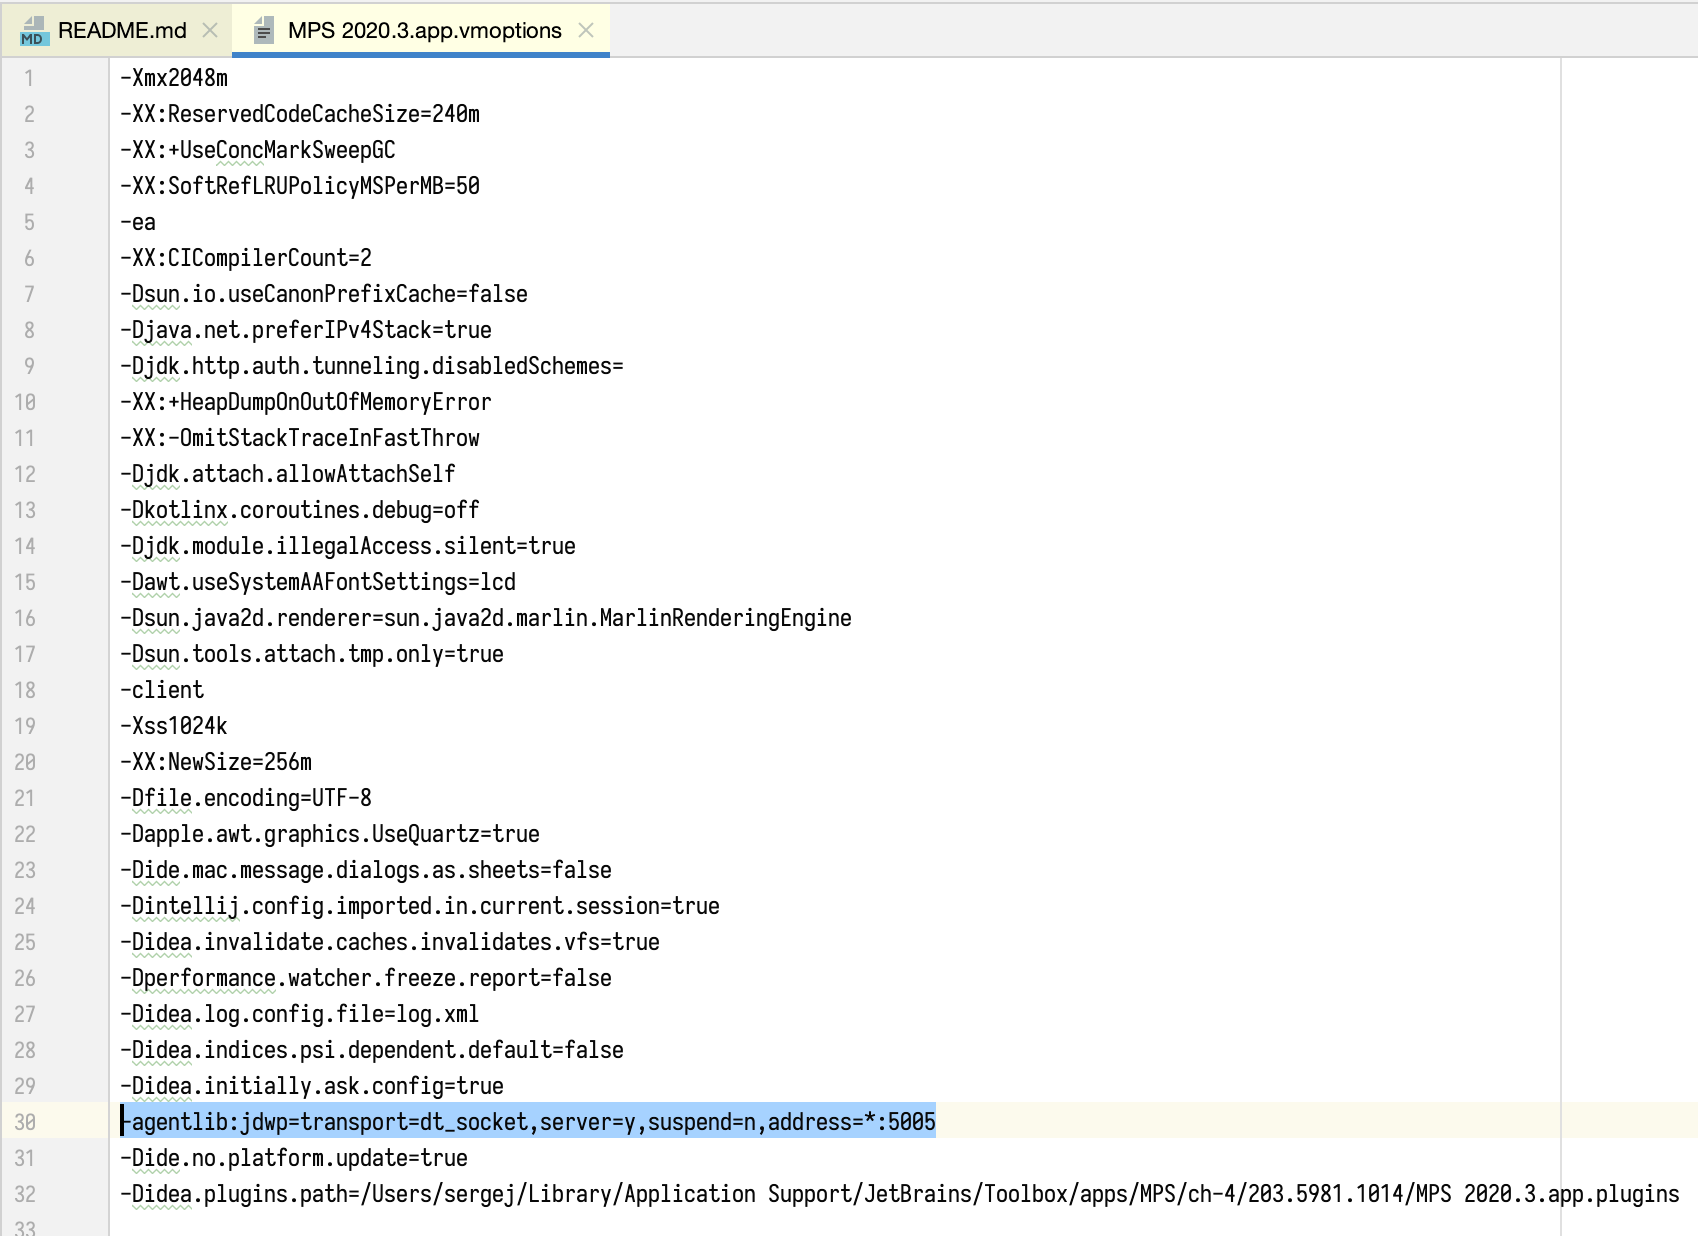
Make sure that the
suspendparameter in the option is set ton. This option tells MPS to start without waiting for a debugger to attach at startup, but keep a port open for a debugger to attach at any later time. -
Restart MPS to activate the new VM options.
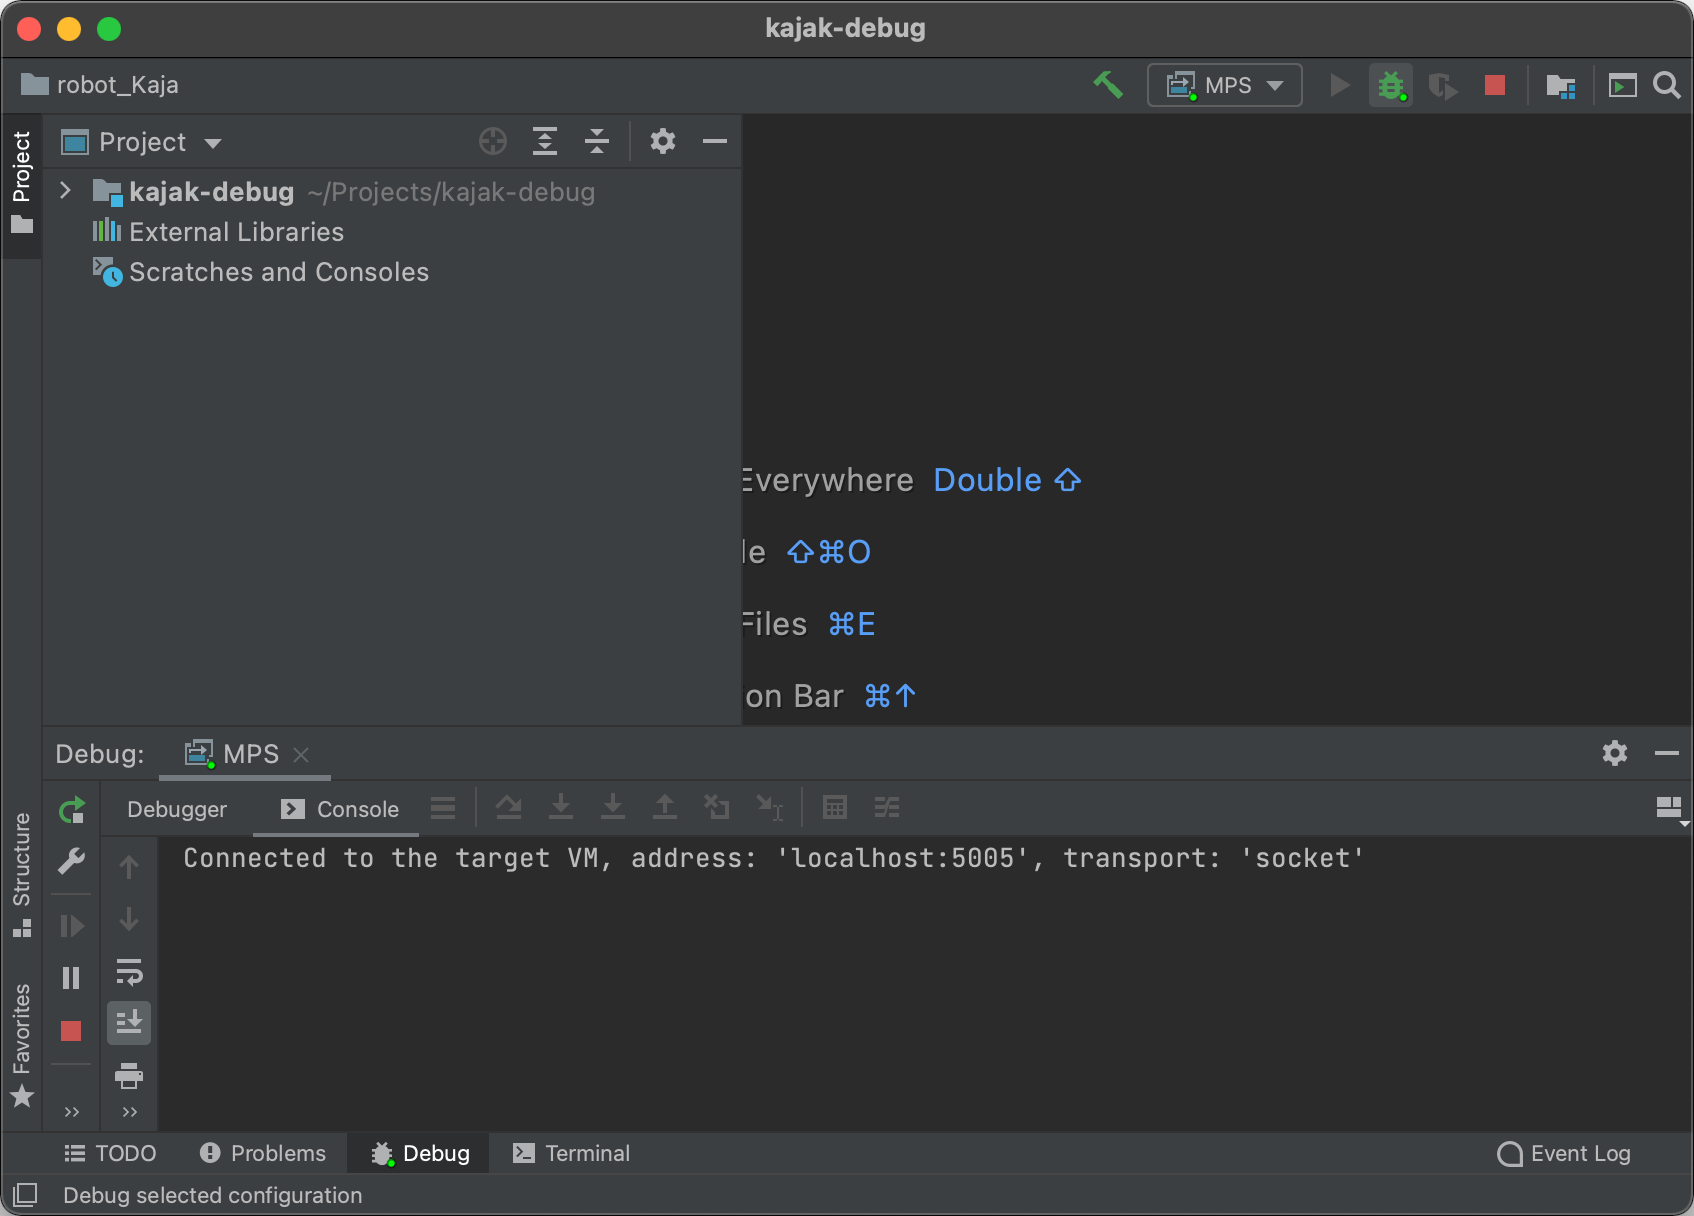
At this point, starting the run configuration by clicking on the green bug icon in the toolbar will attach the debugger to the running MPS instance:
Adding generated sources to IDEA
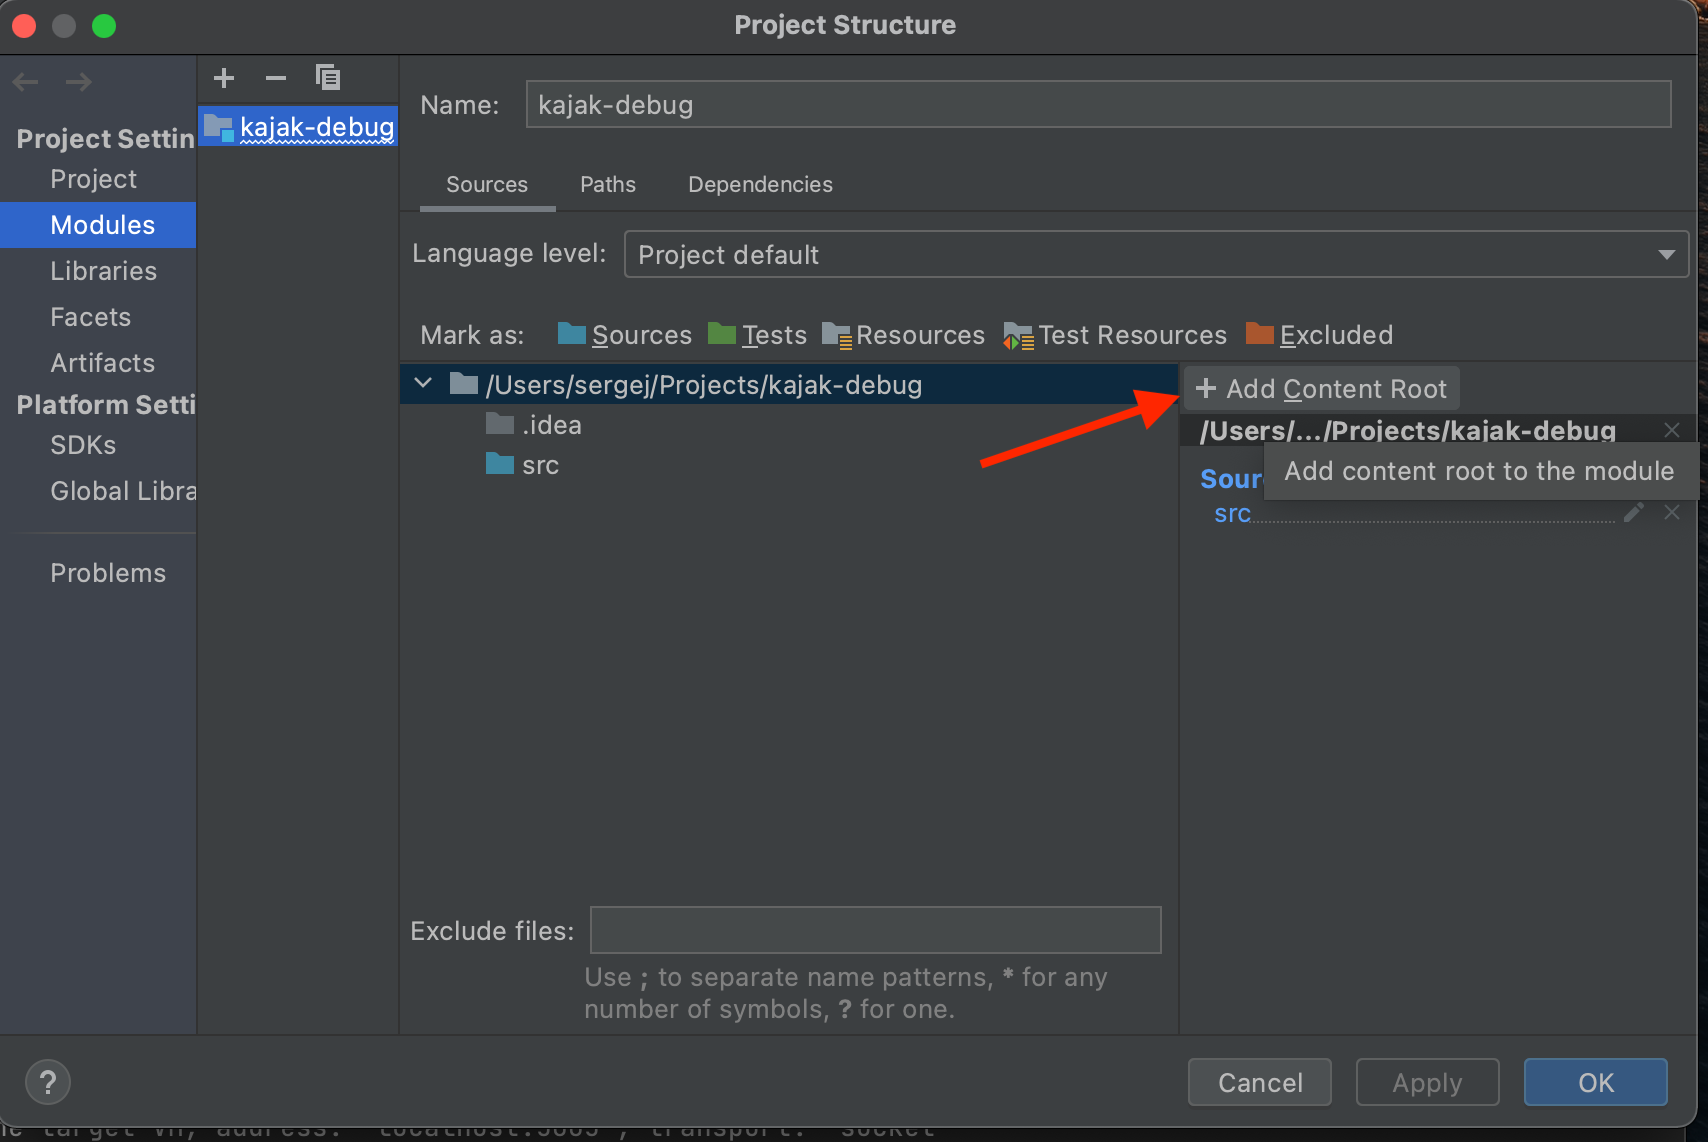
Technically, at this point we are debugging remotely. However, we have no way yet to set a breakpoint in our code because our project doesn’t contain our code! Let’s fix this by adding a content root to the project:
-
Open Module Settings for the main module:

-
Click on the “+ Add Content Root” text on the right-hand side:
-
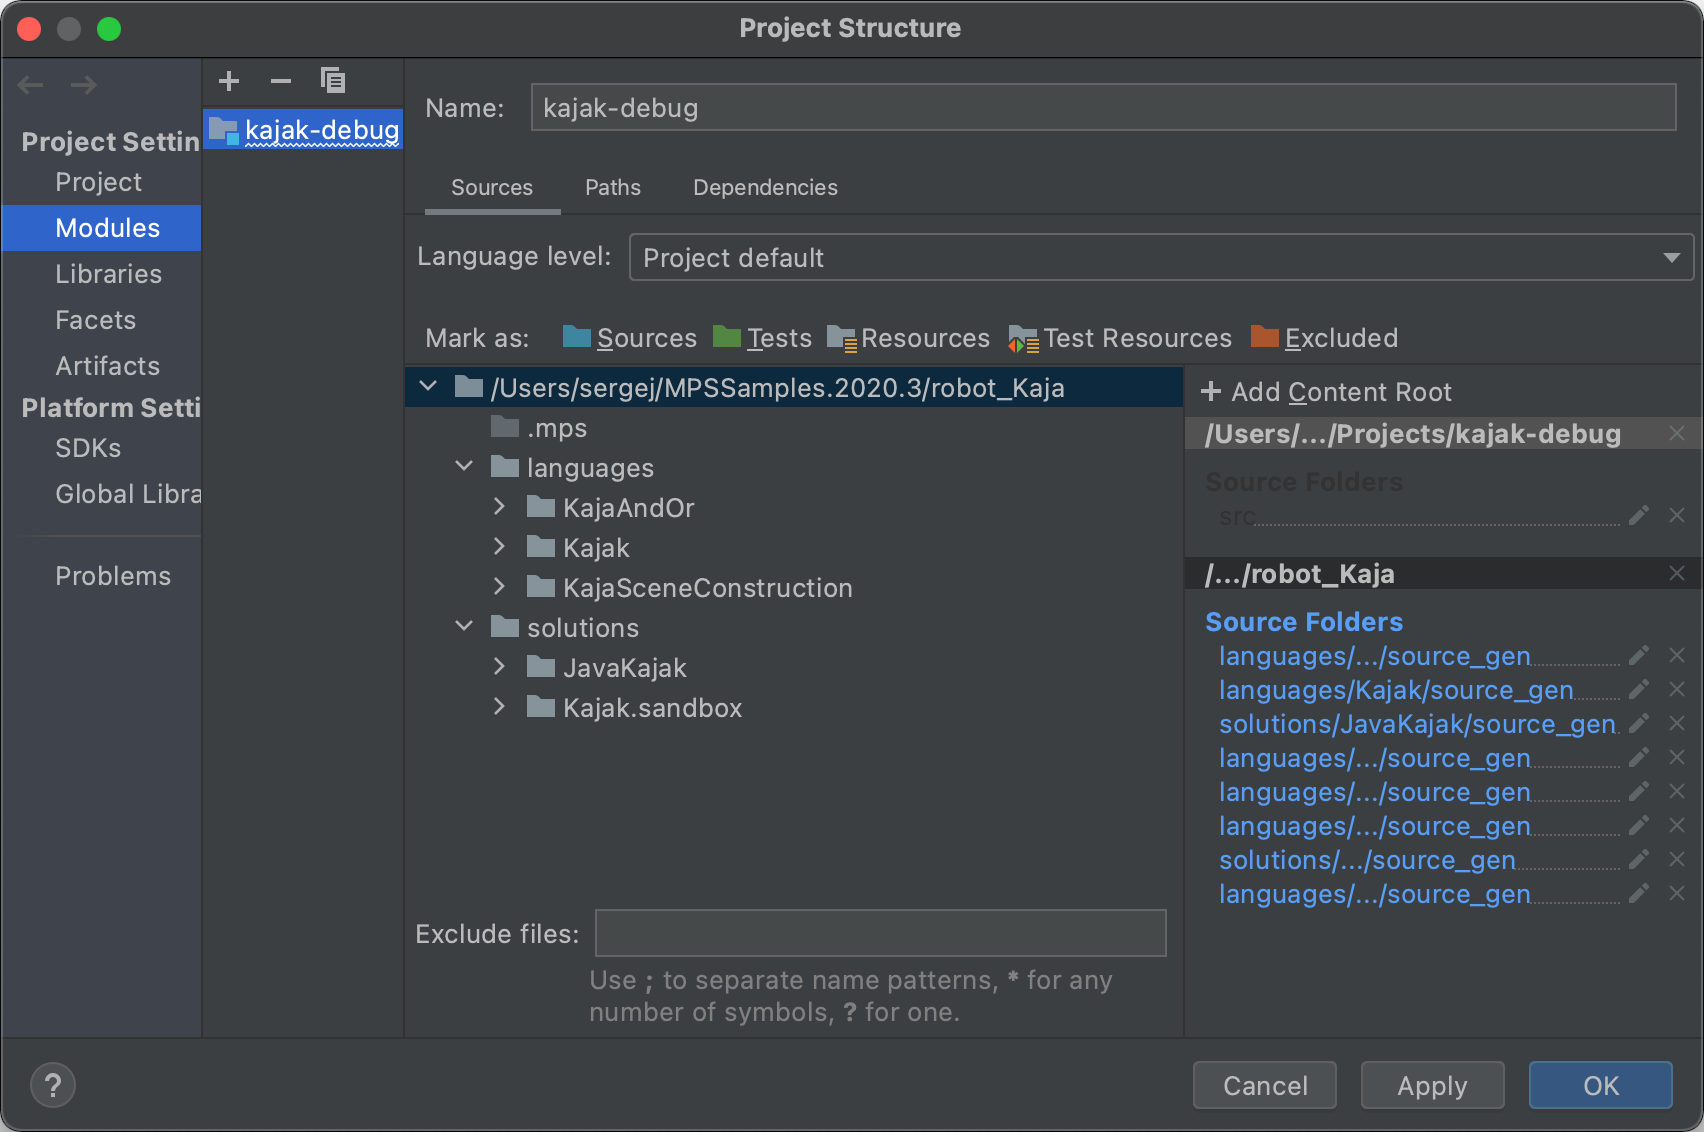
Add the directory containing the MPS project. IDEA will automatically detect directories that contain generated sources and mark them as source directories:
-
After pressing OK we are able to navigate to our generated sources:

-
We can now set a breakpoint and have MPS stop on it. Mission accomplished!
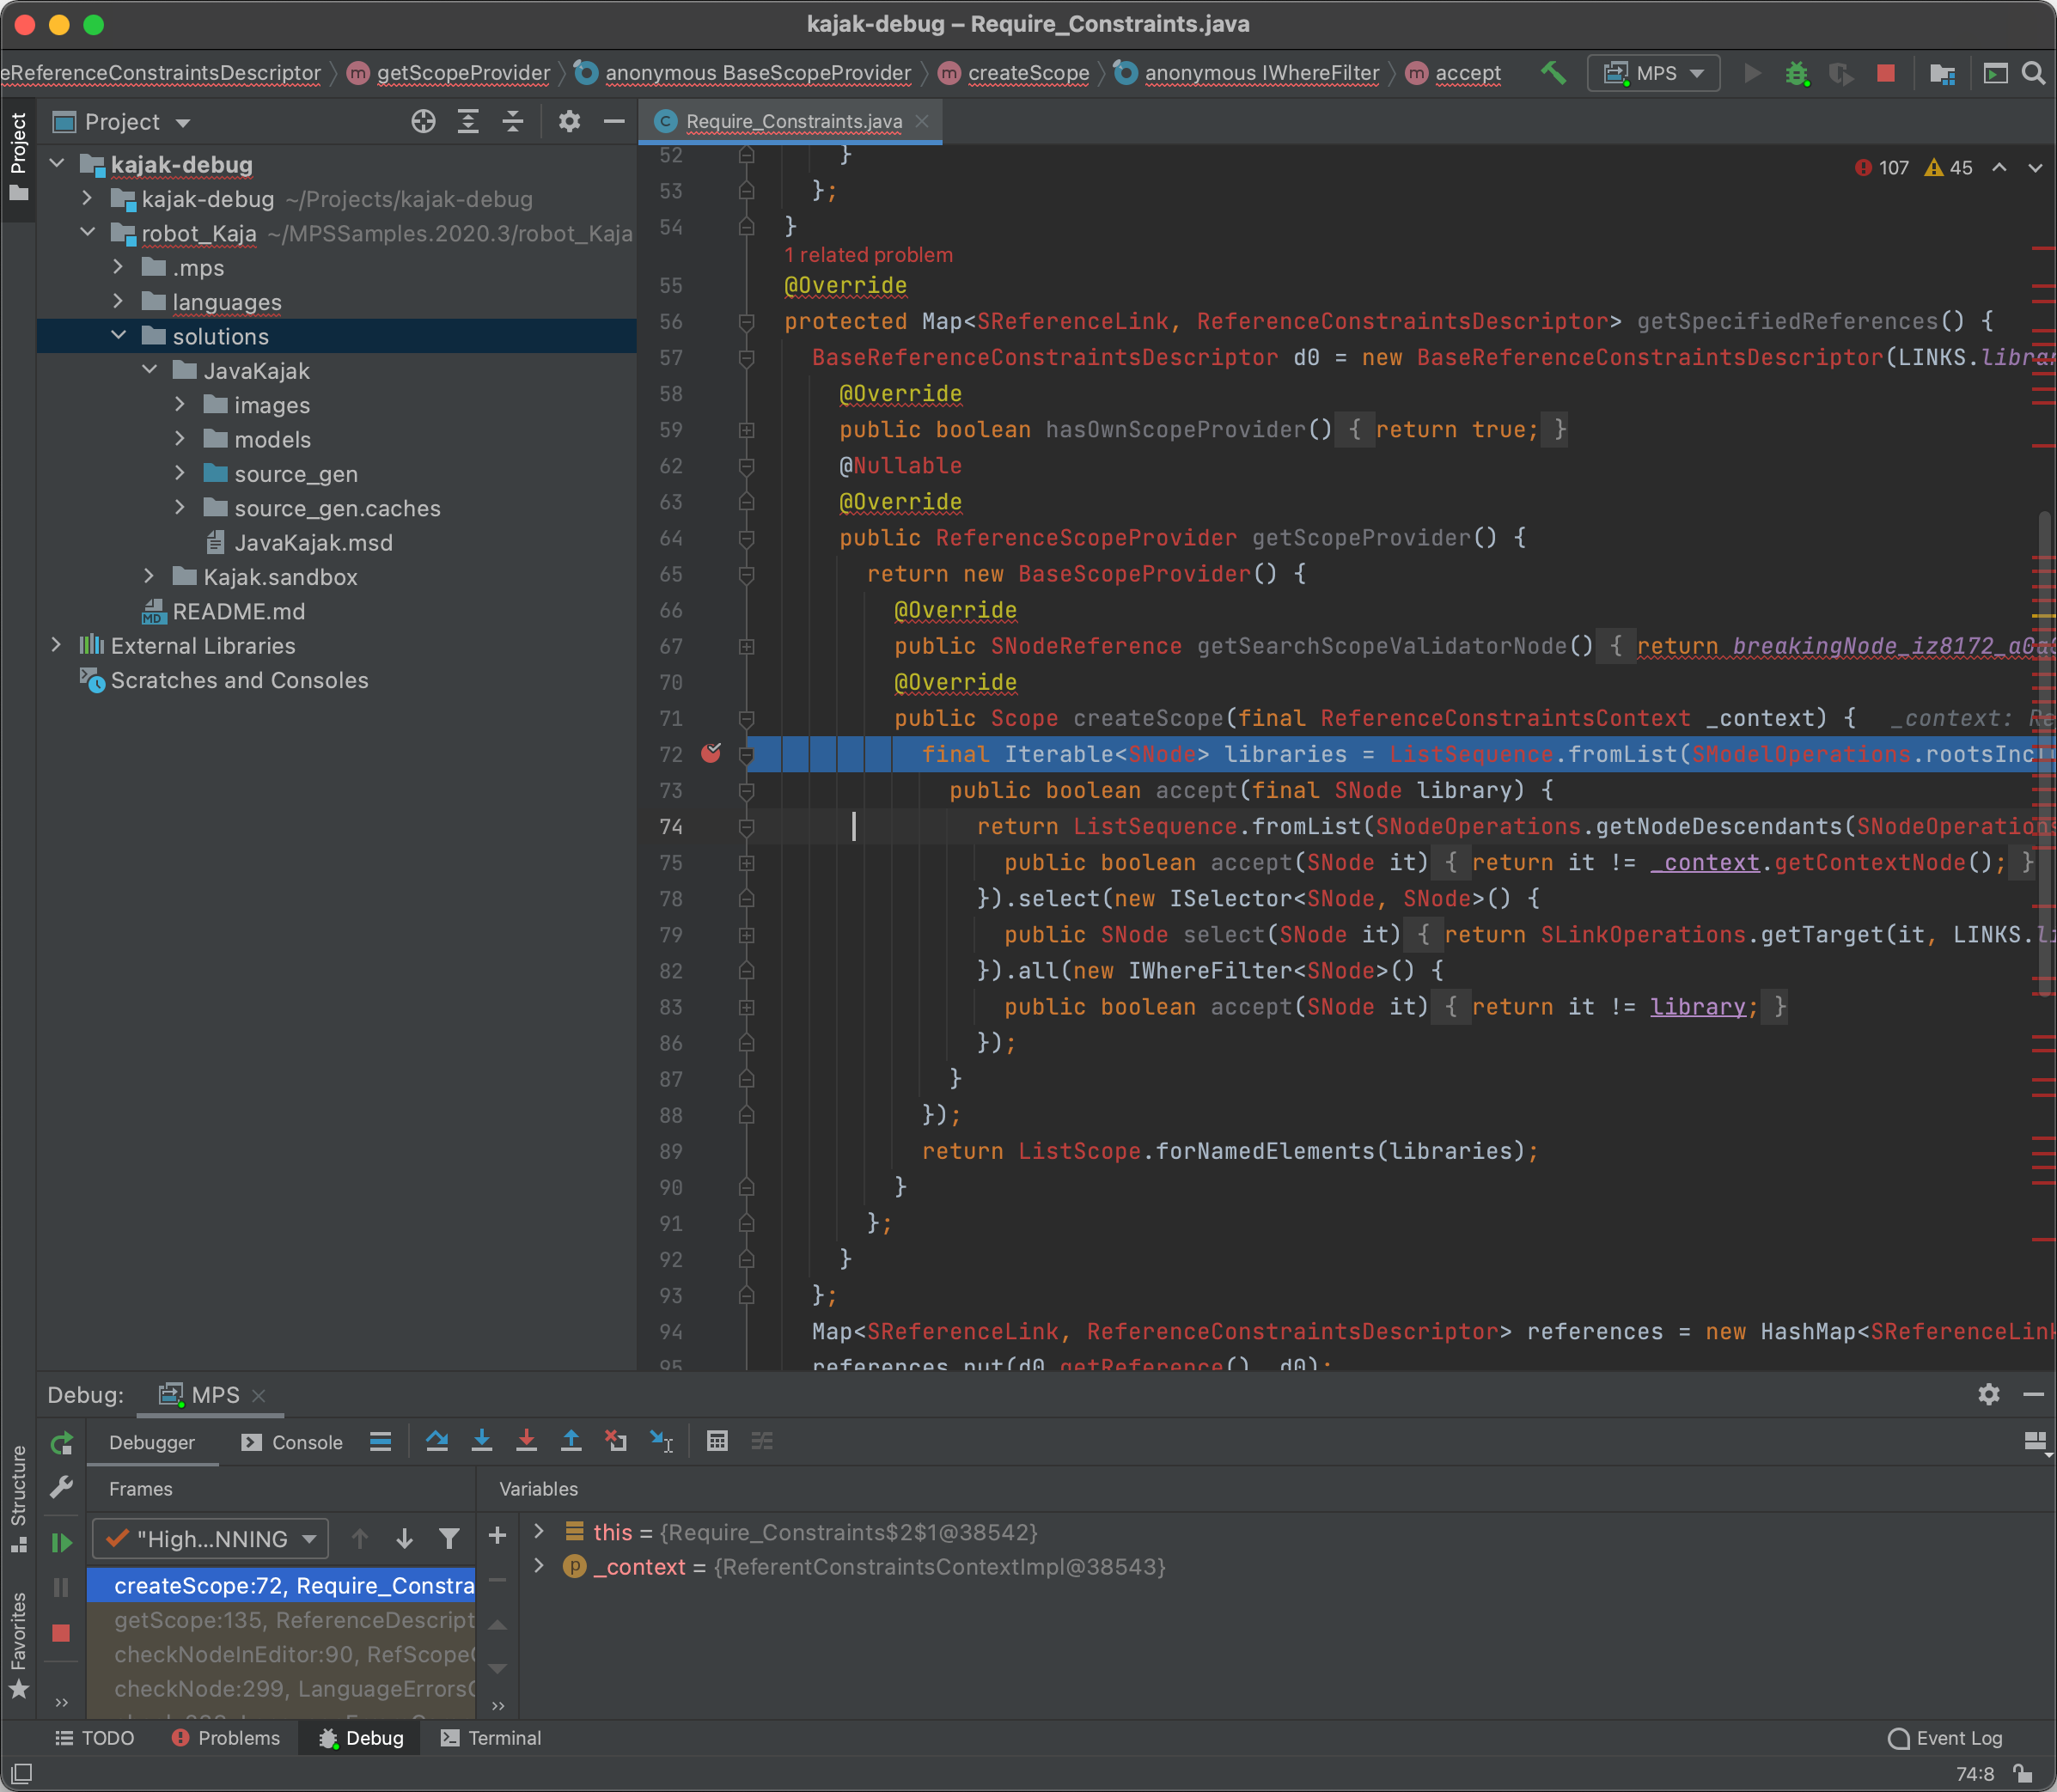
Why is everything red?
Note that a large part of the example file on the screenshot is shown in red, suggesting there is some error there. The underlying cause is that the generated code refers to many MPS runtime classes but we didn’t add any MPS sources to our IDEA project.
We can ignore these errors, at least until the point when we need to step into MPS internals. At that point, it would make sense to check out MPS code and add it to the project in the same way as we added our generated code.