MPS offers several logging mechanisms suitable for different use cases and different users.
Logging to the Messages tool window
You can have your messages appear in the Messages tool window, looking like this:
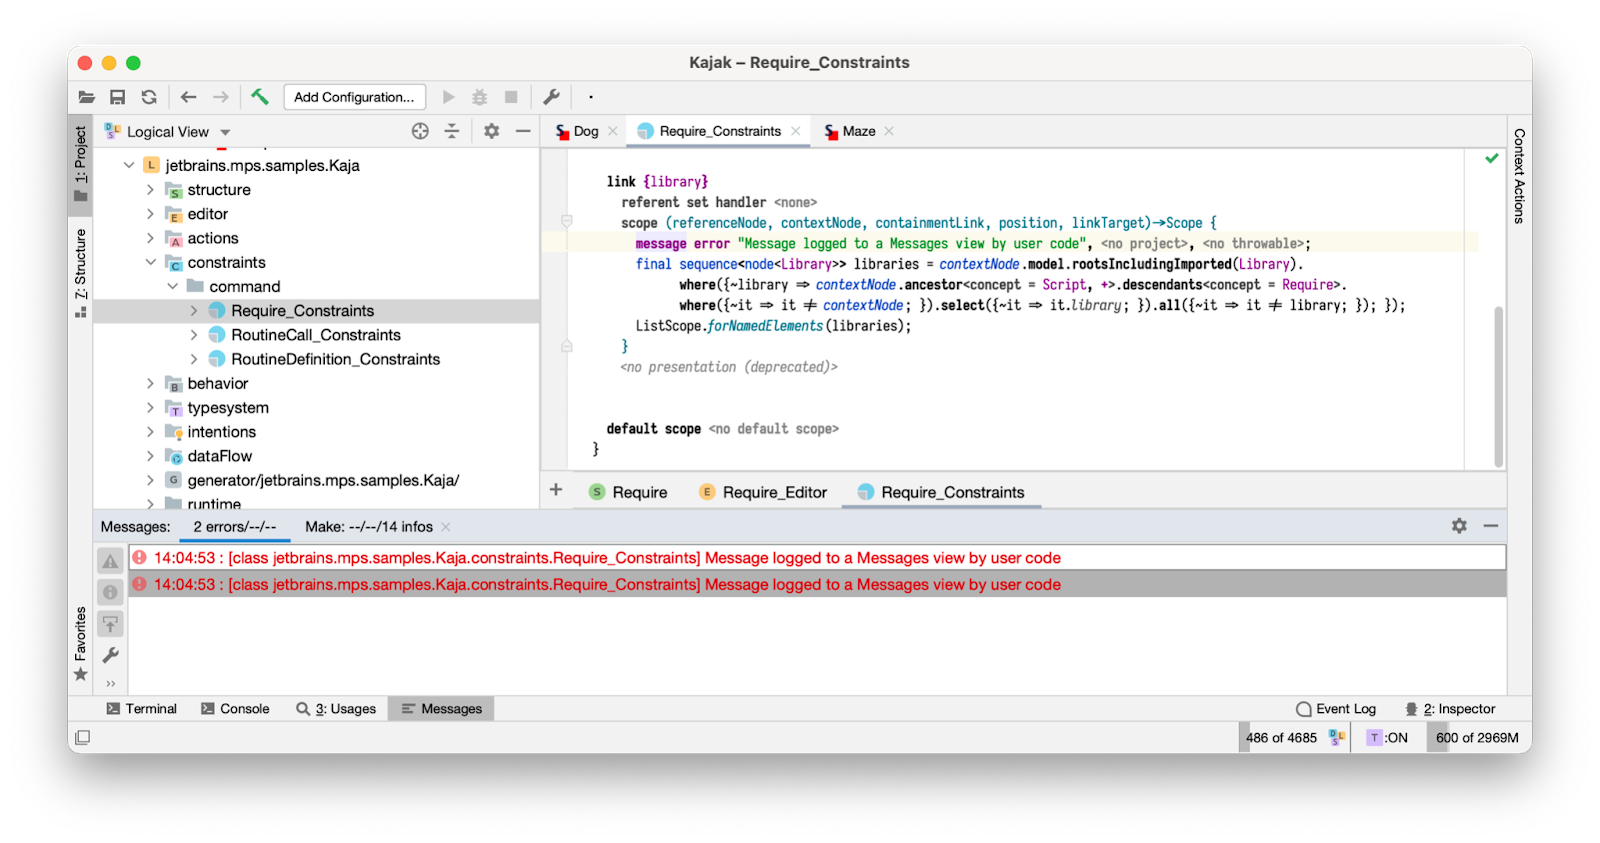
Logging to Messages tool window
To log a message:
- Import the
jetbrains.mps.baseLanguage.logginglanguage into your model using Import Language action (Ctrl+L/Cmd+L). - Add
messagestatements (message error,message info, etc.) to your code. Provide the current project if possible. - After you rebuild and rerun the affected code, the message will appear in the Messages view.
Notes
- The message will appear in a separate unnamed tab, not in the usually selected Make tab.
- Providing the project to the message statement is optional but recommended. If you do not provide a project and you have multiple project windows open at the same time, the messages could appear in the wrong one.
Logging from the generator
The generator context, genContext, provides a show operation to log a message to the generator output:
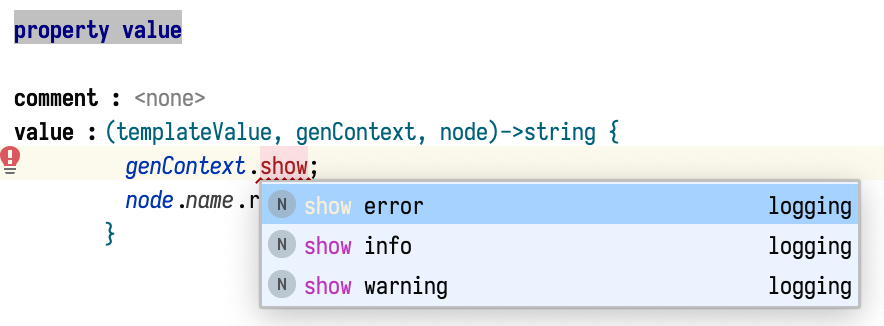
Generator `show` operation
The message will appear in the Make tab of the Messages view when the generator is run in the IDE, but will be logged to the build output when the generator is invoked from command line:
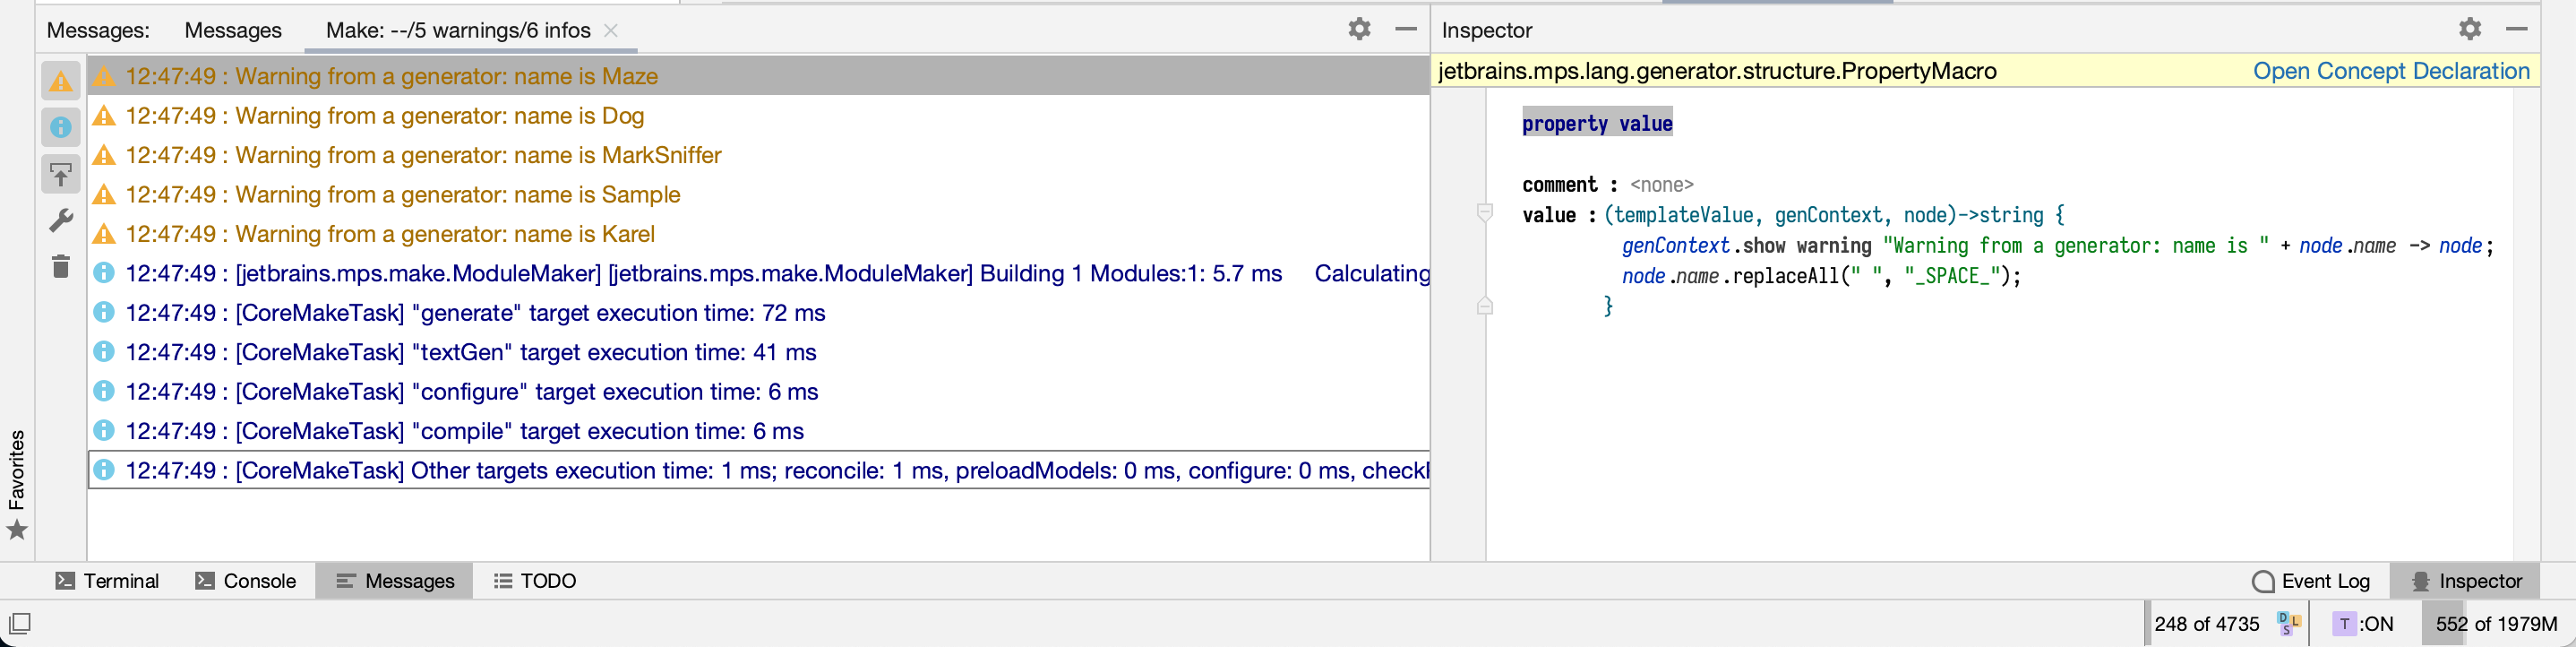
Messages produced by the generator
A message can be optionally associated with a node, in which case clicking on the message in the Messages view will open the associated node in the editor.
Notes
- By default, only warnings and errors are shown. Informational (
info) messages have to be explicitly enabled in the generator settings (Settings/Preferences → Build, Execution, Deployment → Generator in the IDE, with no apparent way of enabling them for command line builds).
Logging to the console or log file
Rather than using the Messages tool window, you can have your code log to the MPS log file.
- Import the
jetbrains.mps.baseLanguage.logginglanguage into your model using Import Language action (Ctrl+L/Cmd+L). This step is the same as when logging to the Messages view. - Add
logstatements (log error,log info, etc.) to your code. Compared to logging to the Messages tool window you don’t need to provide the current project. - By default,
debugandtracelevel logging is disabled. To enable debug logging, use the Help → (Diagnostic Tools →) Debug Log Settings menu action.
To view the logs, you can do one of the following:
- Help → Show Log in (Finder/Explorer) to find the log file; this typically opens your local file browser and points to the log which you can the open with a text editor or log browser tool of your choice.
- You can use the Fernsprecher plugin to view logs in the browser.
- Start MPS from the Terminal/Console (see the next section).
- If you start using logging heavily and need a performant, filterable solution, you can use Apache Chainsaw to view the MPS log.
Notes
- The log file is usually called
idea.log, but it rotates, so if you have a lot of logging, the log entries you are looking for may be already rotated away intoidea.log.1,idea.log.2, etc.
Logging to stdout or stderr
You can print to the Java System.out or System.err but you may be wondering where the output goes and how you can
see it.
To view the output, you have two possibilities:
- Start MPS from the terminal/console and watch the logs in the terminal window.
- Use the Fernsprecher plugin to view the terminal output in the browser.
Starting MPS from the console or terminal
On Windows, modify mps.bat or mps.sh to use java instead of javaw. Be careful, selecting text in the console
blocks the terminal output and may thus hang MPS.
On macOS, start MPS from the Terminal by running MPS <version>.app/Contents/MacOS/mps.
Notes
- MPS 2020.3 disables console logging so you will not see any output unless you manually edit
bin/log.xml, which may require extra permissions on Windows or violate application integrity rules on Mac. MPS 2021.1 brings console logging back.